Create and Customize a Report
Asset Panda realizes that different organizations have different needs. One of these needs is the ability to not only create, but to customize reports. This is exactly why we are going to walk you through steps on how to do just this...create and customize your reports!
NOTE: Occasionally, your reports may make their way into your spam folder. Please remember to check your can of spam, uh, your spam folder if you don't see your report(s) in your inbox.
Note that the editing template is the same for all types of Asset Panda reports:
- Group Reports
- Action Reports
- Change Reports
- Audit Reports
Let's get this report party started!
How do I create a report?
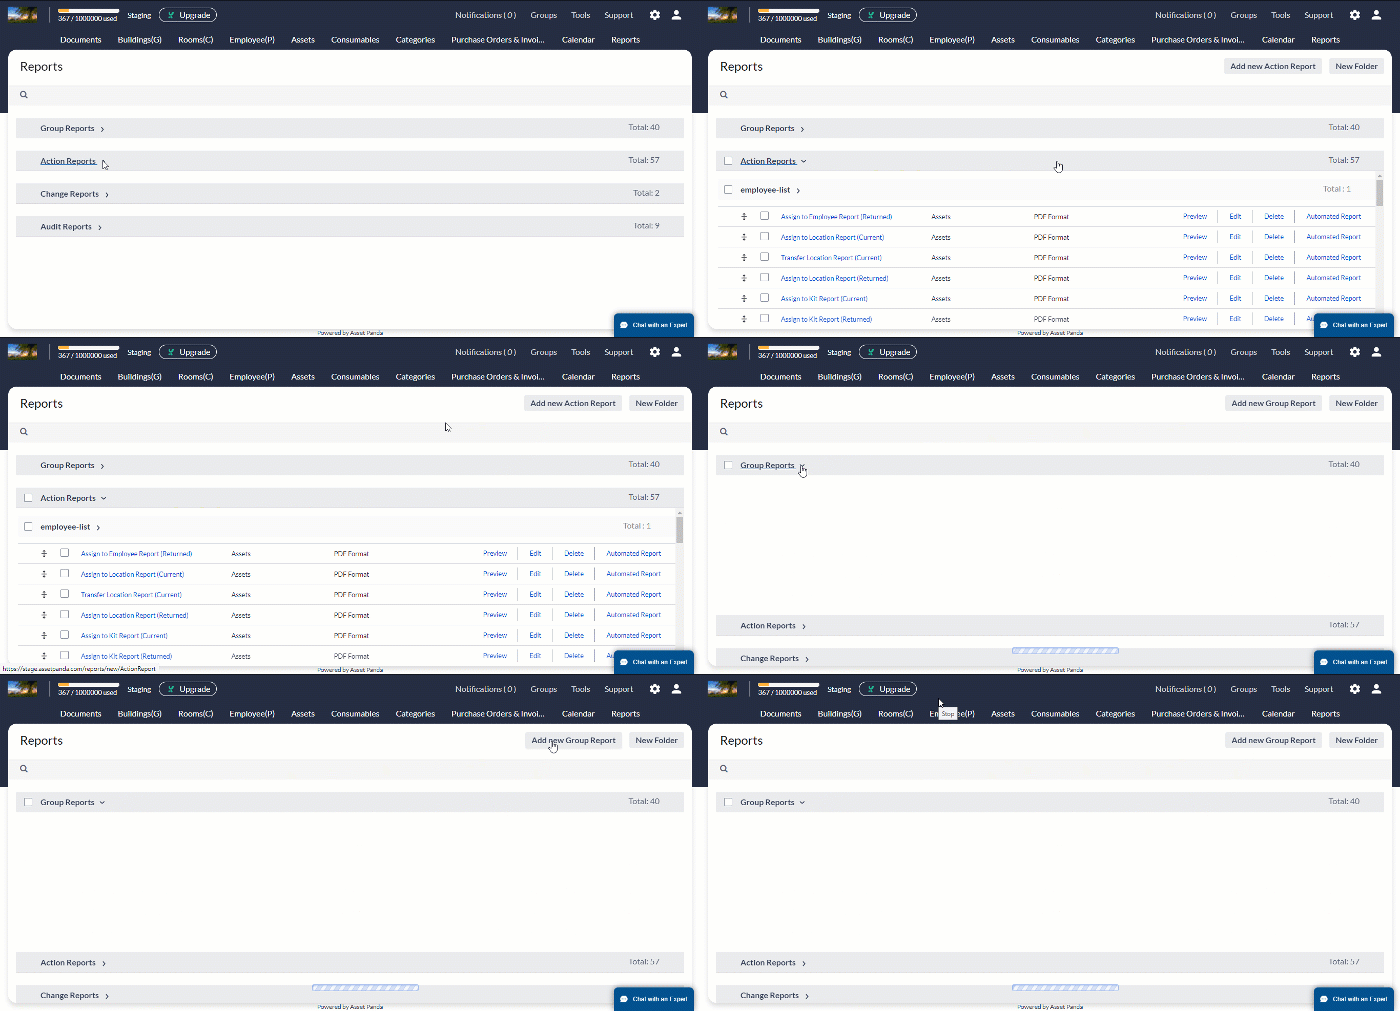
1. Navigate to your Reports landing page (see Navigate Reports for more details).
2. Select the report type of where you'd like to create your new report, and then click the Add new report button. (The report type labeled on this button changes depending on the report type you have selected.)

NOTE: There is the option to duplicate an existing report, so that you don’t need to create an entire report from scratch each time. Please refer to the Duplicate Reports article for more info!
3. Name your report within the Name field. This field is required. (Everyone needs a name. Right?)
4. Select the Output for your report. Reports can be downloaded and previewed as a PDF document, a CSV file (Microsoft Excel), or even a screen shot.
Choosing the PDF output options requires just a bit more customization options. You'll have the option to set different parameters like font size, page orientation and so forth.

5. Select the Page Size of your report. You'll be able to choose between Letter or A4.
6. Select your page Orientation. We offer the usual...portrait or landscape.
7. Check the box if you would like to Add Gridlines. This option just inserts a thin, black line to separate each row or line item on the report...kind of like notebook paper.
8. Select your preferred Font Size. 8px is the smallest, while 20px is the largest.
9. Select the Group in which you would like your report to pull data from.
NOTE: Only reports with a PDF output have the option to Sum Currency Fields, Sum Numeric Fields, and the default image of the asset (see Steps 10, 11, and 14).
10. Select Yes or No for Sum Currency Fields. The sum is calculated per column on the report. The total currency sum for all line items on the report will be listed at the very end of the report.
11. Select Yes or No for Sum Numeric Fields. The sum is calculated per column on the report. At the bottom of the report, there will be a sum calculating the total number of lines on the report.
12. Select Yes or No for Display Company Logo. (You would upload your company logo by clicking your settings icon, and then Company Settings.)
13. Select All Objects or Select Objects. This option allows you to select all records (all objects) within the group in the report, or one record (select objects) from the group in the report.
When you choose Select Objects, a field displays so that you can type a phrase or a few characters from the field set as the Primary Default in that group. A drop-down list of relevant results expands, allowing you to select your preference. (Example: If the Primary Default in the Assets group is set to be the Description field, type a few characters or a phrase contained in the Description of the asset you are looking for.
14. Select Yes or Not to Include the Default Image (or not) off an image of the asset on the PDF report.
15. Click the Add new filter link within the Filter by section to set filters for your report. This allows you to set one or more limitations to narrow down the results displayed within your report. It may even include information that you wish to see just for yourself. Check out some examples on how you can use these report filters:
- Example: Set a filter on a Group Report based on Asset Category. As a result, the report could be set to only include assets that have the category of something such as laptops.
- Example: Set a filter on an Action Report based on a Date Performed field in a Repair action. As a result, the report could be set to only show assets that had the Repair action used within the previous month.
16. Click the Order by another field link within the Order By section to filter the results by ascending or descending order based on a specific field. By default, the report sorts by ascending.
- Example: Asset ID is the first column on your report. Ordered By descending by the Asset Category field. The resulting report will list all assets in ascending order based upon Laptop; then list assets in ascending order based upon Desktop, etc.
17. Proceed to the next section.
How do I populate fields into my report?
Not only are fields required for you to save your new report, they also help the report know where to pull the data from. Otherwise, having a report probably wouldn't do you much good. (And it's likely that most people probably don't run reports just for fun but if you do, no judgement here!)
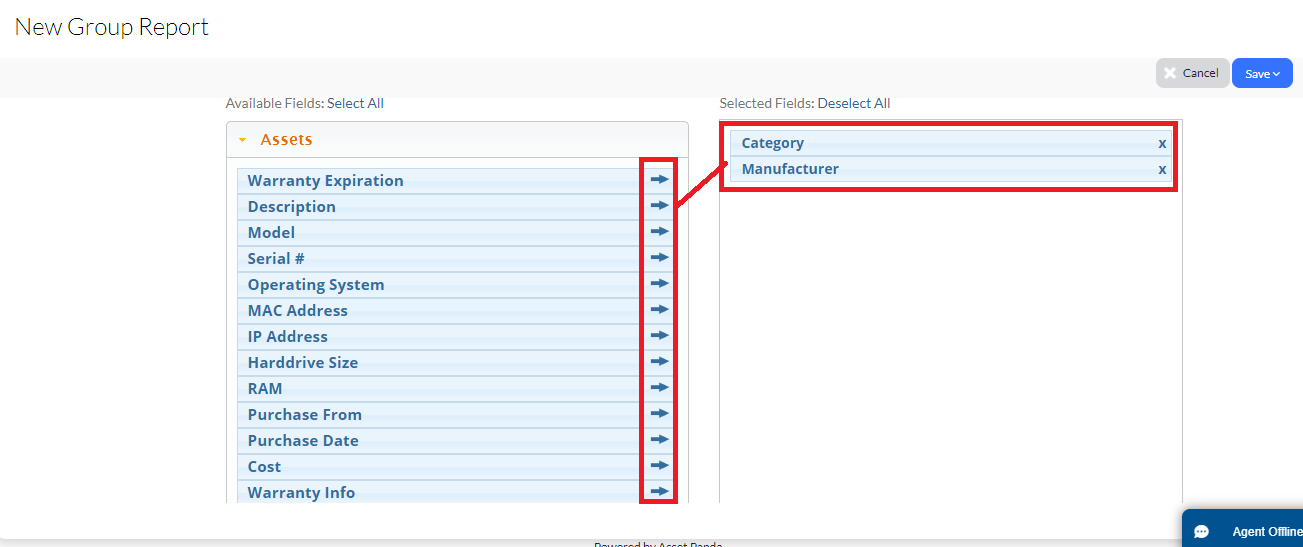
Scroll down to the the Available Fields section of your Reports page. Here, you will find all the data points that you can select to display on your report. Click the arrow of the field you would like to include.
You will notice that those fields begin to populate within the Selected Fields section. These are the fields that will display on your actual report. You can also of course choose to Select All if you want them all. The choice is all yours!

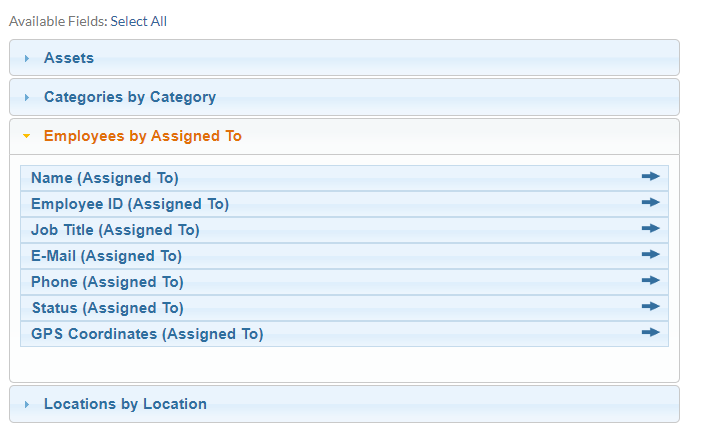
You can also pull in fields of data from linked groups. These links between groups are established through your group list fields. (See Update List Fields for more information on how to set these up.)

How do I group reports?
Lastly, let's discuss how you can organize your report with our Group by feature. Grouping is a really useful tool because it organizes your results on the report by using a specified parameter. As an example, let's say you would like to group the report by Building. When the report is generated, it lists all of the assets located in Building A, then all of the assets in Building B and so forth.
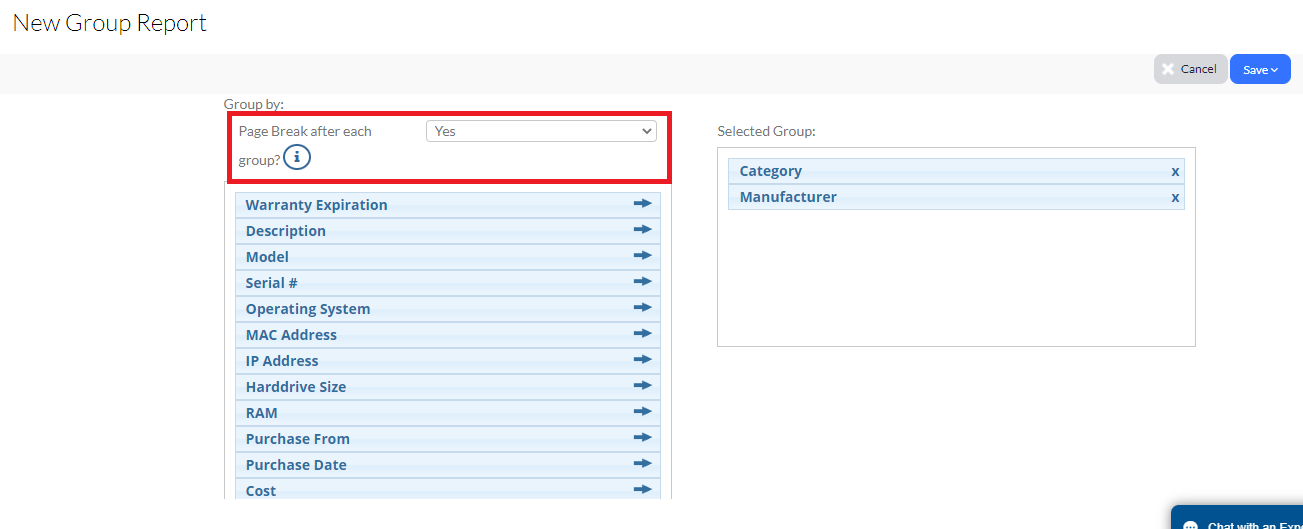
And...just when you thought it couldn't get any better, we tell you that you can also insert page breaks into a report based on a grouping.
Just select Yes for the Page Break after each group drop-down menu, and then select groups based on where you want your page breaks to be.
