Calendar and Gantt Chart Formatting
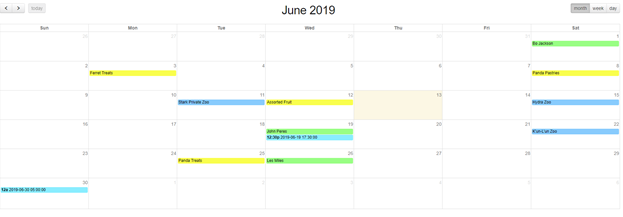
Asset Panda monitors events that occur on your assets or in groups and can display these events on a single calendar or Gantt chart. Items are color coded within an Asset Panda Gantt chart to define the event type.
Examples include:
- Assets that are out on loan and due to be returned may appear in blue on the scheduled return date.
- Insurance that is due for renewal may appear in green 30 days prior to the expiration date.
- Assets out for repair may appear in yellow.

Gantt chart calendar view
The standard monthly calendar format is the default. You have the option to select a weekly or daily display from the calendar view page. (See Calendar Events or Calendar for more information on how to set up your calendar.)
You may however wish to set your view to the Gantt Chart. To do this:
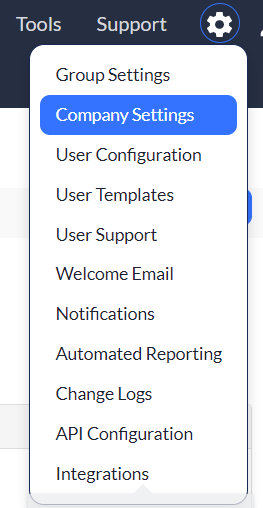
1. Click to select your settings ![]() icon, and then select Company Settings.
icon, and then select Company Settings.

2. Scroll down to the Calendar View, and then use the drop-down menu to select Gantt Chart.

3. Select Save Options to save your changes.
Print your calendar
You can print either a view of the monthly calendar or select a specific date range from the Gantt view:
- Monthly Calendar- Simply open your calendar and select the print icon. This will print the page that you currently have open.
- Gantt Calendar - If you would like to print within a specific date range, just click on the print icon and select the date range that you would like to print.
Related Topics