Add Dashboard Charts
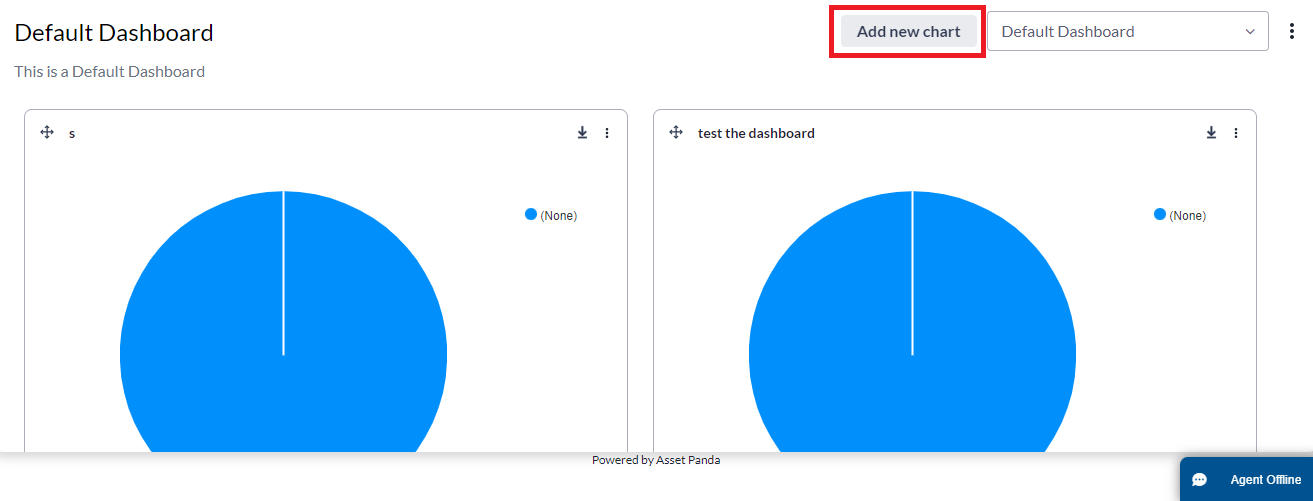
To add charts to your dashboard template (your Dashboard page may look different than those shown below, depending on your current settings and configurations):
1. From your Dashboard page, select Add Chart.

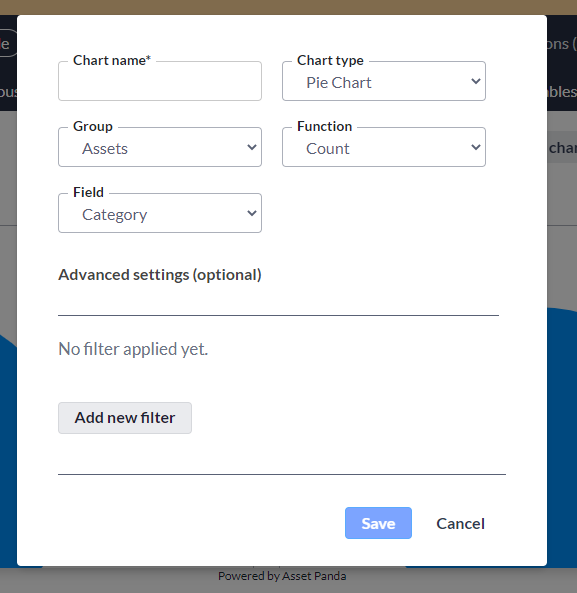
2. Click Add Chart and you'll see lots of cool options.

Let's go over these options so you'll be better able to make some really great, creative decisions.
NOTE: Fields that contain an asterisk symbol (*) are required fields.
- Chart name*: Enter the preferred name for your new chart. This field is a required field.
- Chart type: Use the drop-down menu to select the style of chart you wish to have (note that some of your options may change, depending on your chart type):
- Pie Chart (select your Group, Function, and Field)
- Bar Chart (select your Group, Function, and X axis)
- Line Chart (select your Group, Function, and X axis)
- Record Count (select your Group and Function)
- Group: This is a required field. Use the drop-down menu to select the group you wish to see displayed on your chart. (Any group that has a link to another group displays within the list of options.)
- Function: Use the drop-down menu to select one of the following:
- Count: Select to display the total number of all items in the chosen classification (X field).
- Sum: Select to display total of the values displays in selected field (X field).
- Date: Select to display a date field. Allows you to group by Day, Week, Month, Quarter, and Year. (Good for warranty expiration, next service date, date added, and so forth.)
- X field: This is a required field. Use the drop-down menu to select any group, list, or date field to include in the chart.
- Y field: This is a required field if you select Sum or Date as the Function. Use the drop-down menu to make the selection of your choice.
- Advanced settings: Provides you the option to apply specific filters and values to your chart. Select the Add new filter button, select your Filter by drop-down menu, and then apply your preferred filter selections (the options here change depending on your Filter by selection).
3. Click Save to save your new chart, and to view it on your Dashboard page.
You can either scroll through your charts or use the filter feature to find a specific chart (once you have multiple charts, of course.)